Stackprof VS Rbspy
I’ve been learning a bit about Ruby profilers lately, in particular rbspy & stackprof. These profilers allow you to see what your code is doing over a given interval of time.
Stackprof is the OG ruby profiler - it’s a C extension wrapped in Ruby. Rbspy is a relative newcomer to the scene - it was written in Rust by Julia Evans. Both rbspy and stackprof are sampling profilers, this means that at a given interval they take a snapshot of the stack.
Getting Started
Let’s write a short program to profile. The program will (inefficiently) calculate the Fibonacci sequence.
# fibonacci.rb
class Fibonacci
  attr_reader :n

  def initialize(n)
    @n = n
  end

  def calculate
    sleep 0.01
    if n > 1
      Fibonacci.new(n - 1).calculate + Fibonacci.new(n - 2).calculate
    else
      1
    end
  end
end

# run_fib.rb
require_relative './fibonacci'

10.times.map do |n|
  result = Fibonacci.new(n).calculate
  puts "Fib #{n}: #{result}"
end
We can run this program with:
ruby run_fib.rb
Flame Graphs and Rbspy
The most useful way I’ve found of using these profilers is to generate flame graphs. Flame graphs are really cool - time flows to the right on the x axis of the graph and the stack trace at a given point in time.
Rubyspy spits out “classic” SVG flamegraphs when we run it by default. After installing rbspy we can run and profile our program:
sudo --preserve-env rbspy record ruby run_fib.rb

# we see a bunch of other output here. Then rubyspy outputs the following:
Wrote raw data to /Users/peterkeogh/.cache/rbspy/records/rbspy-2021-12-15-OE1ehRYCTL.raw.gz
Wrote formatted output to /Users/peterkeogh/.cache/rbspy/records/rbspy-2021-12-15-EGICgQ62qA.flamegraph.svg
We can see our SVG file by opening the .flamegraph.svg file in a browser.
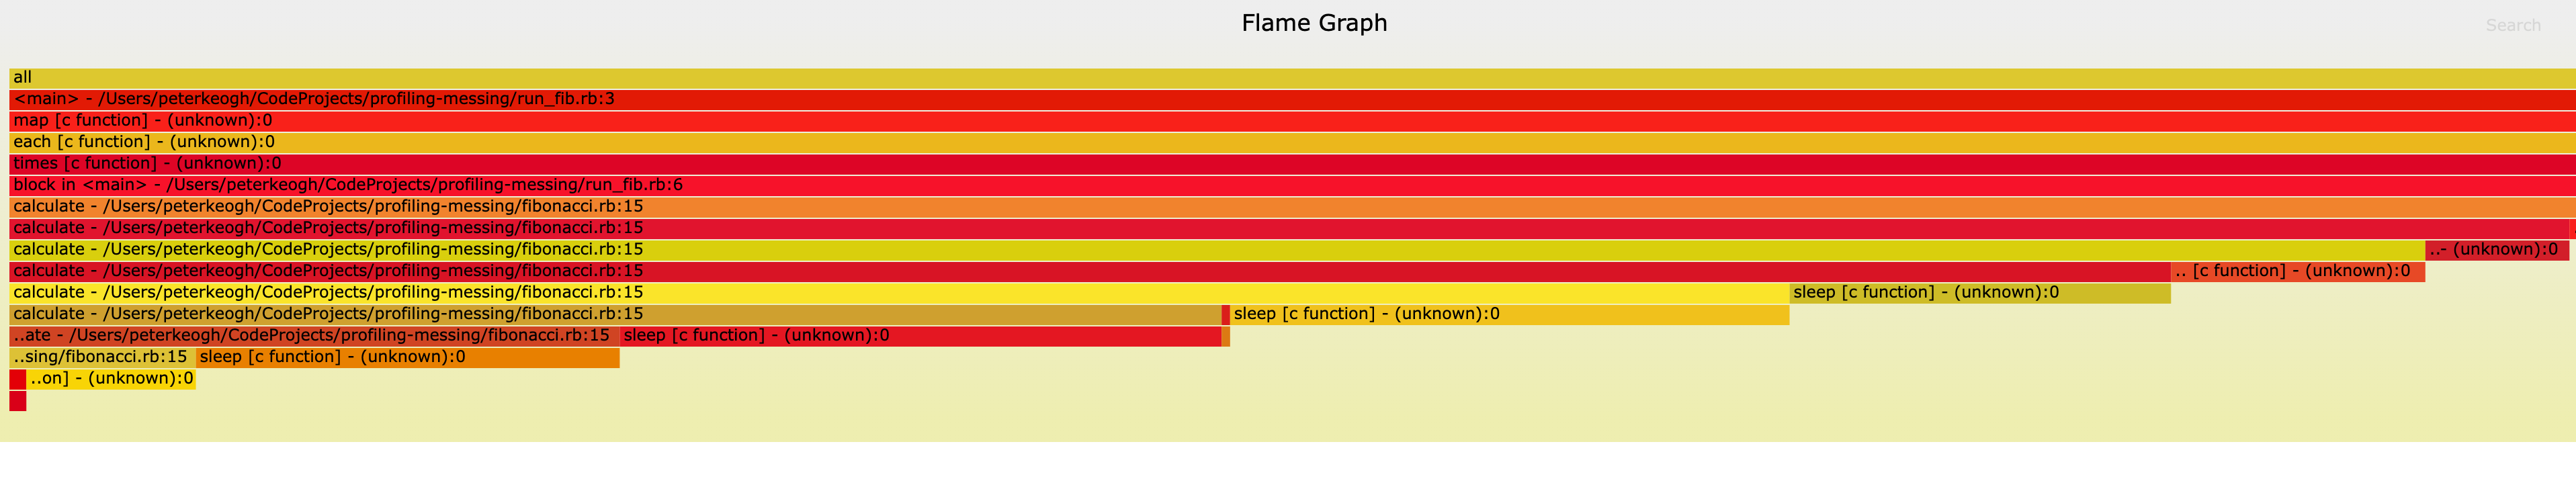
The classic SVG flamegraphs are ok, but for large flamegraphs, these can take a toll on performance in the browser. A much more performant solution is to use Speedscope which renders flamegraphs using WebGL and is much more performant. Rbspy ships with support for Speedscope out of the box - we can rerun our trace and drag the speedscope file onto the speedscope web page in our browser.
sudo --preserve-env rbspy record --format speedscope ruby run_fib.rb
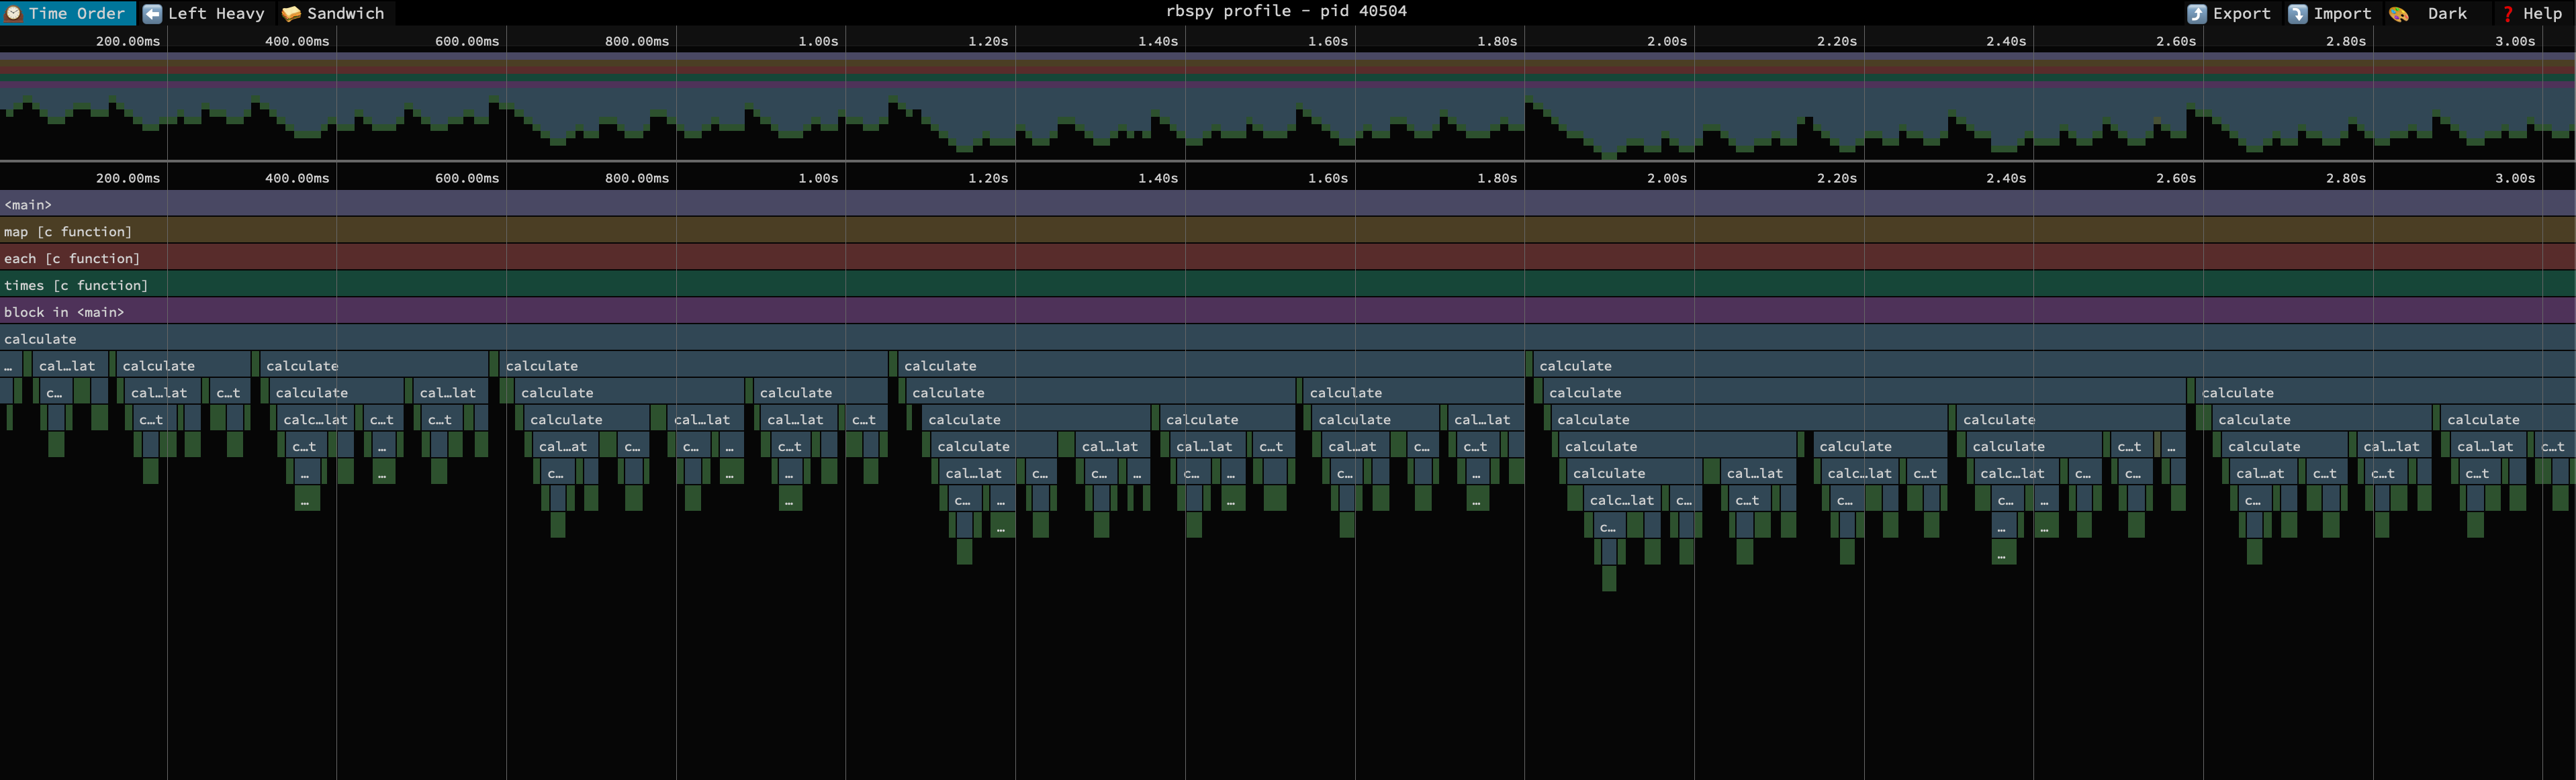
The speedscope flamegraph renders much faster - not only that, it appears to render at higher fidelity, and is a much better representation of what our program is doing. The Rbspy docs say that the default sample rate is 100Hz (once every 10ms) which matches what we see (we see our program sleeping for ~10ms). We miss some of the stack of our program at the beginning - I’m not sure, but I guess this is because rbspy starts the ruby process first to get a PID to profile.
One of the since things about Rbspy is that we can run it without having to change our code. We can also run it against process that are already running. If you have a stalled ruby process and want to find out why it has stopped you can profile it by running:
sudo rbspy record --pid $YOUR_PID_HERE
Stackprof
I consider Stackprof to be the OG profiler. To profile code with it, you need to install the stackprof gem and wrap your code in a Stackprof block. We can profile our code and write the output to a file that we can drop into speedscope:
require 'json'
require 'stackprof'

profile = StackProf.run(mode: :cpu, raw: true, interval: 10) do
  require_relative './run_fib'
end

File.write('fib_profile.json', JSON.generate(profile))
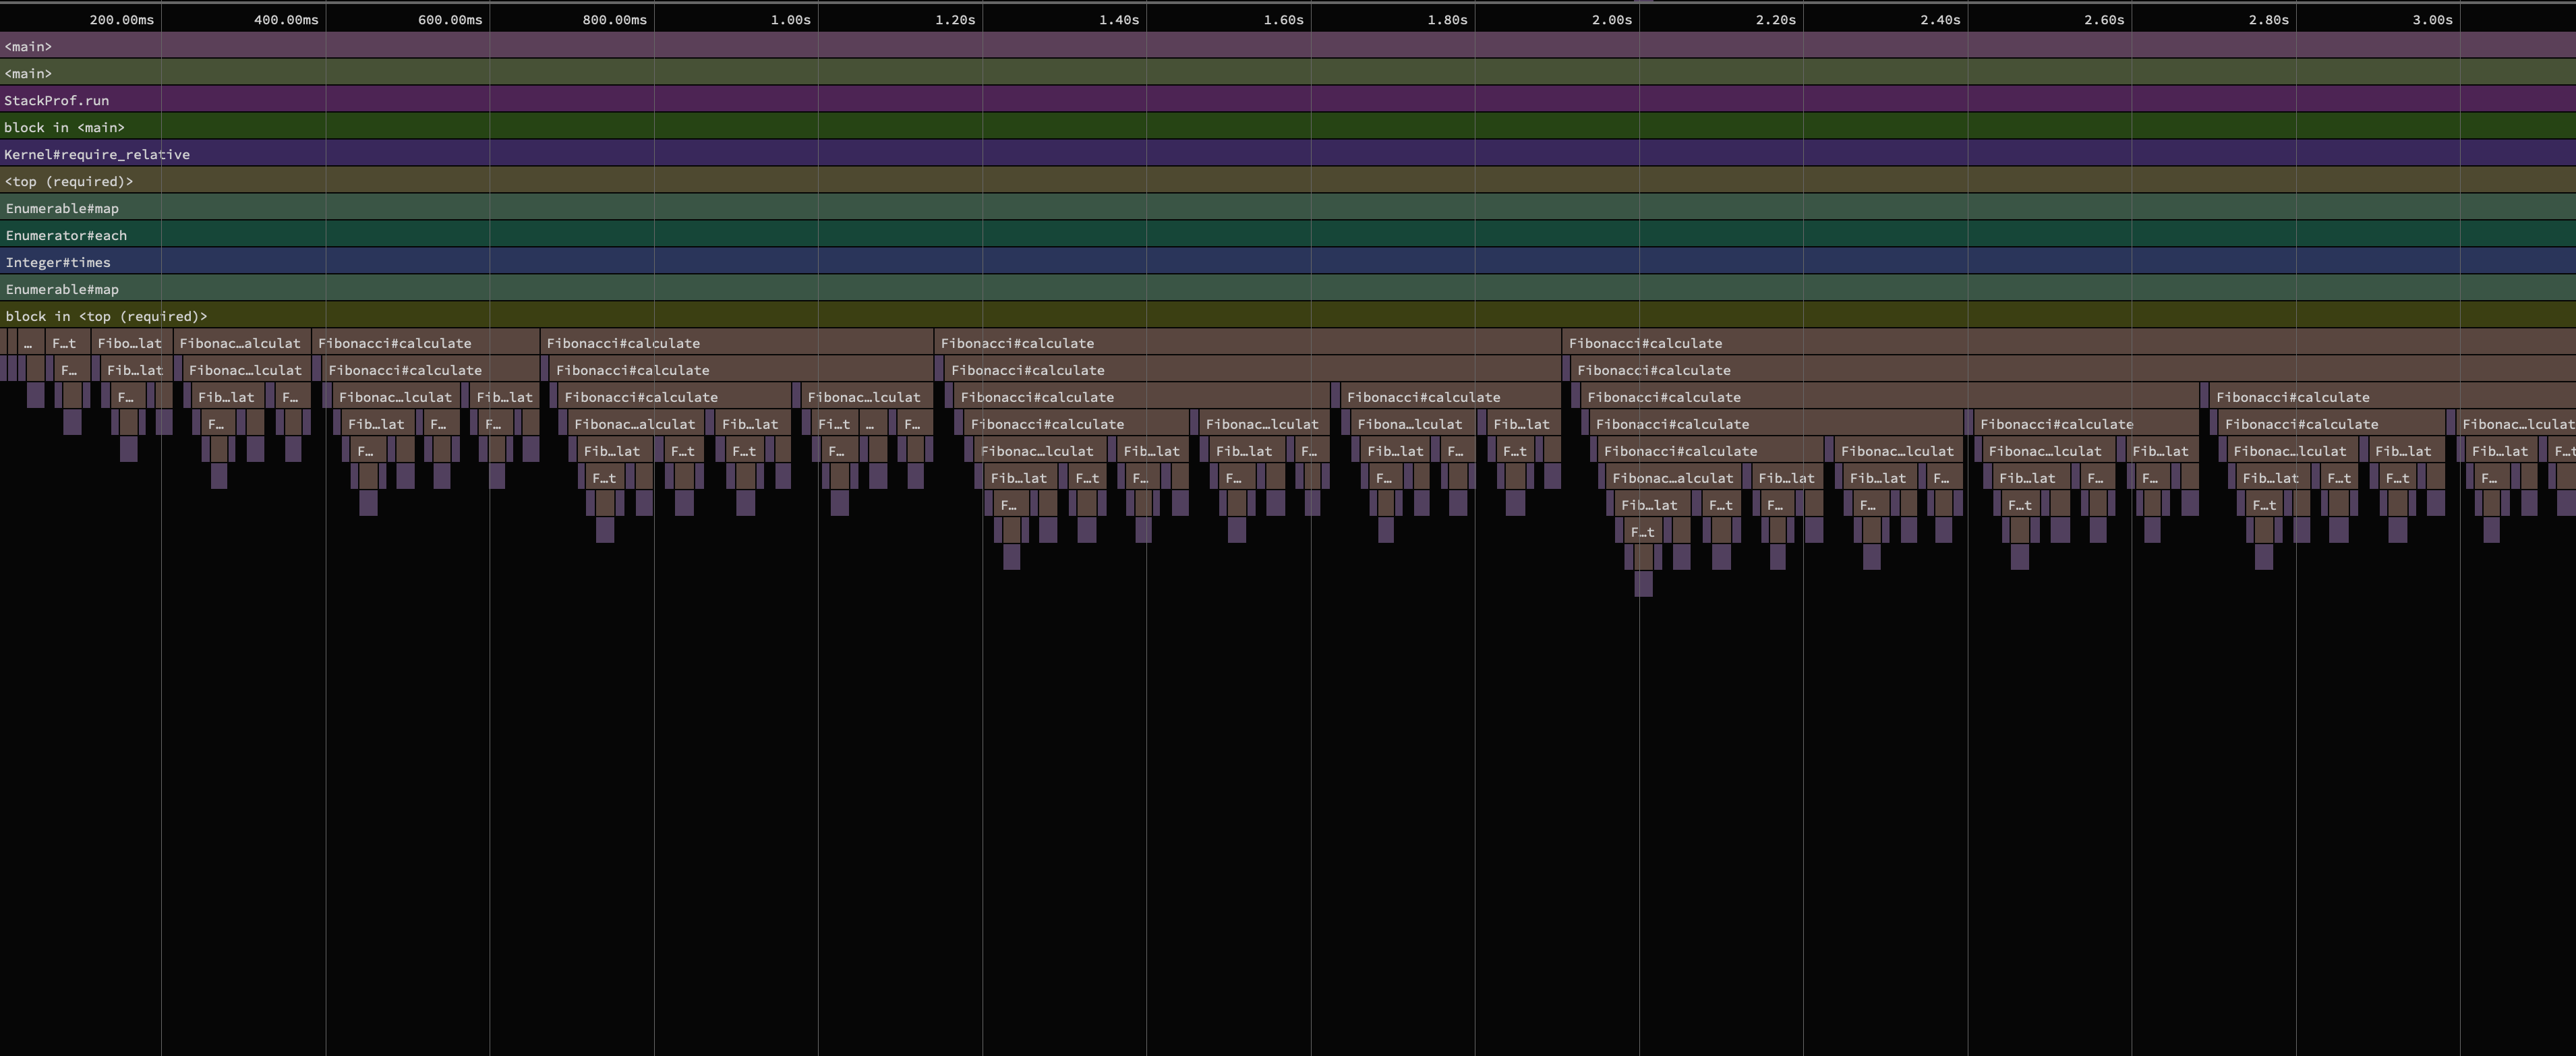
This flamegraph looks similar to the one given by Rbspy. One of the big advantages over Rbspy is that it gives the class name in the trace. This makes it much easier to see what’s going on in a complex Rails application where there are many dependencies and many methods have the same or similar names. This also makes it easier to use speedscopes find functionality to spot what’s going on.
Stackprof profiles the code in a block, so it doesn’t miss the start of our code running like Rbspy does. The default sample rate is 1ms but it has a range of 1 micro second to 1 second.
CPU & WALL
Rbspy uses regular wall clock time (wall) for profiles, but Stackprof supports both CPU and wall options. The CPU option is helpful when we are interested in what our program is doing on the CPU - e.g. when it is not waiting on IO.
We can test this out with the following code:
require 'json'
require 'stackprof'

wall_profile = StackProf.run(mode: :wall, raw: true, interval: 100) do
  10.times do
    sleep 1
    puts "AWAKE"
  end
end

File.write('wall.json', JSON.generate(wall_profile))

cpu_profile = StackProf.run(mode: :cpu, raw: true, interval: 100) do
  10.times do
    sleep 1
    puts "AWAKE"
  end
end

File.write('cpu.json', JSON.generate(cpu_profile))
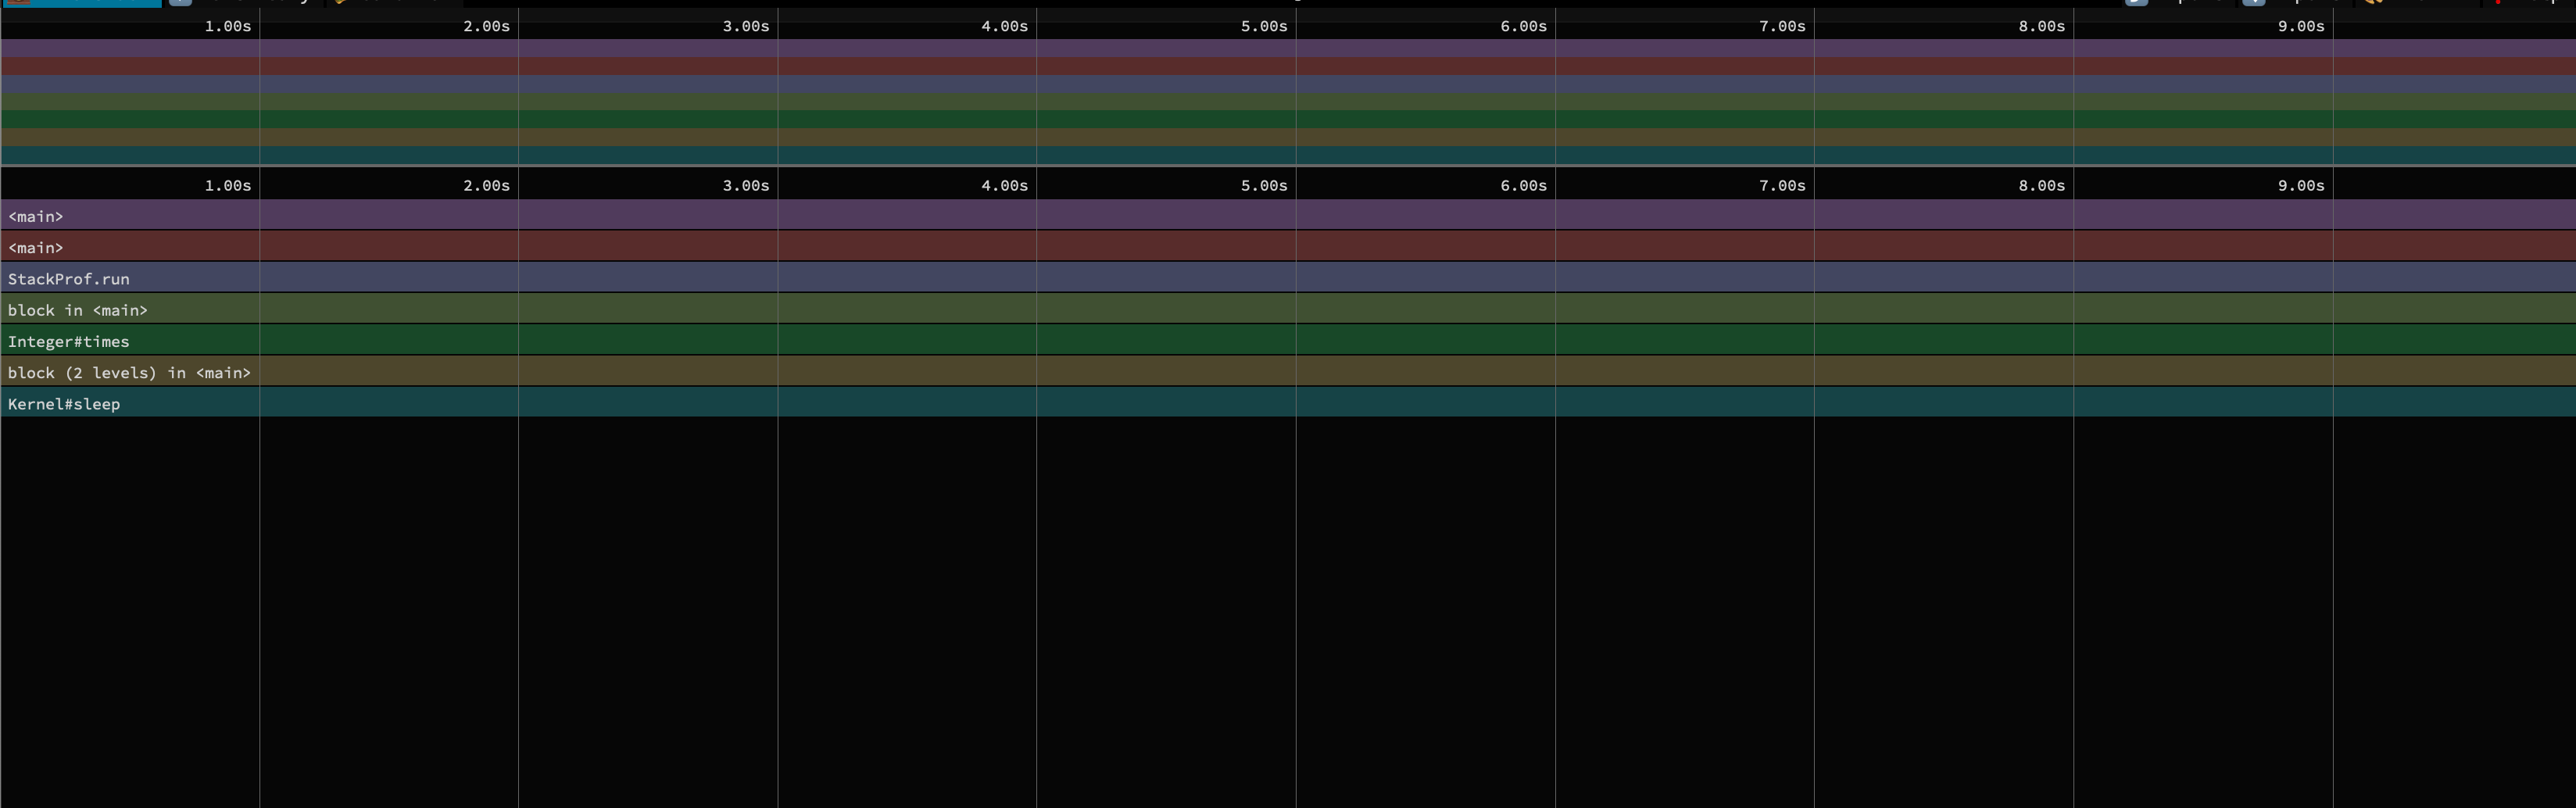
For the first profile we get the following. This is strange - the time seems about right (about 10 seconds) but we don’t see our “puts” calls. This is related to the sample rate of 100 micro seconds. I can see it if I increase the sample rate.
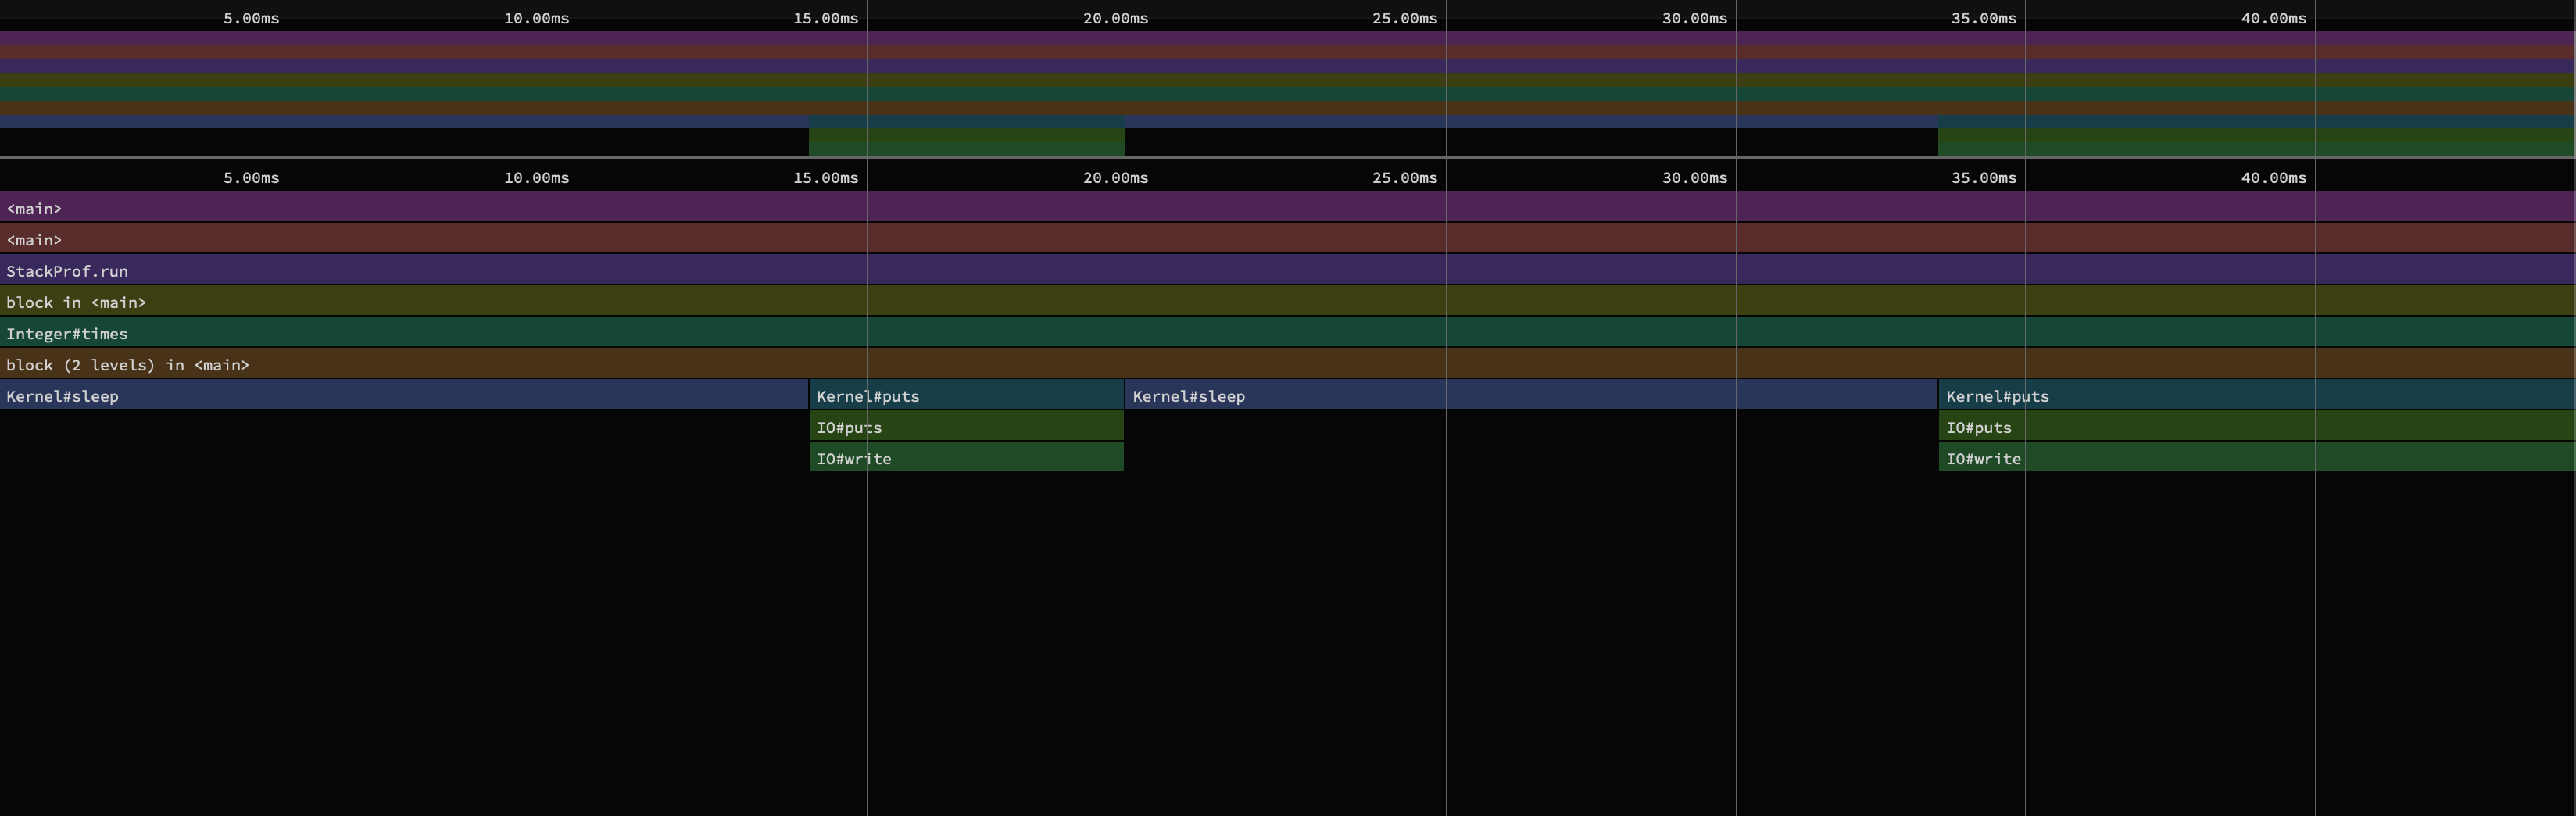
The second profile we get shows the puts calls, but only lasts for 45ish milliseconds. What’s interesting with this profile is if we set the sample rate too low, we don’t get anything at all! If we increase the sample rate, the profile looks like it takes more time. I think this is because stackprof needs to wake the sleeping process to get the trace.
Some Recommendations
I’d like to wrap up the post with some recommendations.
I would recommend using Rbspy when you want to get a profile quickly, without editing code any code. It’s helpful to run on codebases you’re not familiar with or on stuck processes when you want to find out what’s going on.
Stackprof’s flamegraphs are much easier to use in a large codebase. Many companies run it in production to get profiles - Nate Berkopeck has an article on how to run it in production with rack mini profiler here.
Happy perf win hunting!